
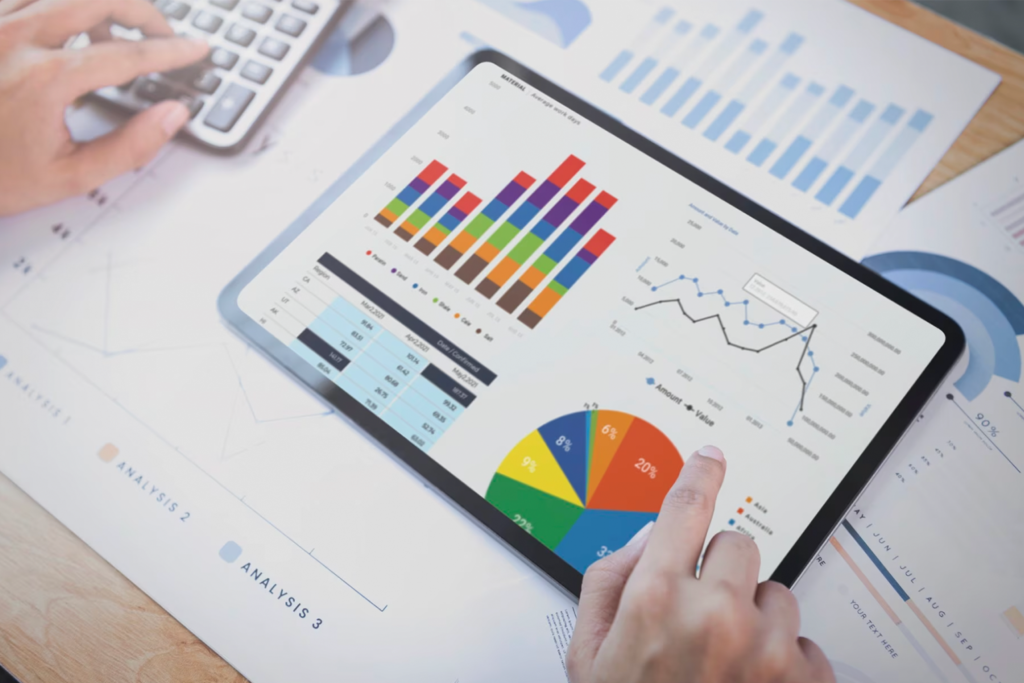
Many businesses choose to label their reports as analytics. In business intelligence, people often incorrectly use ‘Reporting’ and ‘Analytics’ interchangeably. Reporting shares information with business teams, while Analytics involves analyzing this shared information. Reporting is an important part of SaaS.
However, analytics vs reports correspond to two different functions and provide different values in the growth of the business and organization. There is a crucial distinction between stating ‘measuring the performance of the business ‘and ‘analyzing the performance of the business’.
What is a report?
A report can be defined as a structured document that conveys information systematically. Discussing your Sales and Marketing data and disseminating it through emails, presentations, or other mediums is part of reporting.
What is analytics?
Analytics refers to the act of examining, understanding, and conveying meaningful patterns found within data. Analytics involves analyzing deeper into the raw data to understand the reasons behind those patterns and make better business decisions.
ZOHO apps support both data reporting and analytics. The professional charts and graphs in ZOHO apps such as ZOHO CRM, ZOHO Analytics make visualizing and sharing business reporting and the analytics features provide analysis.
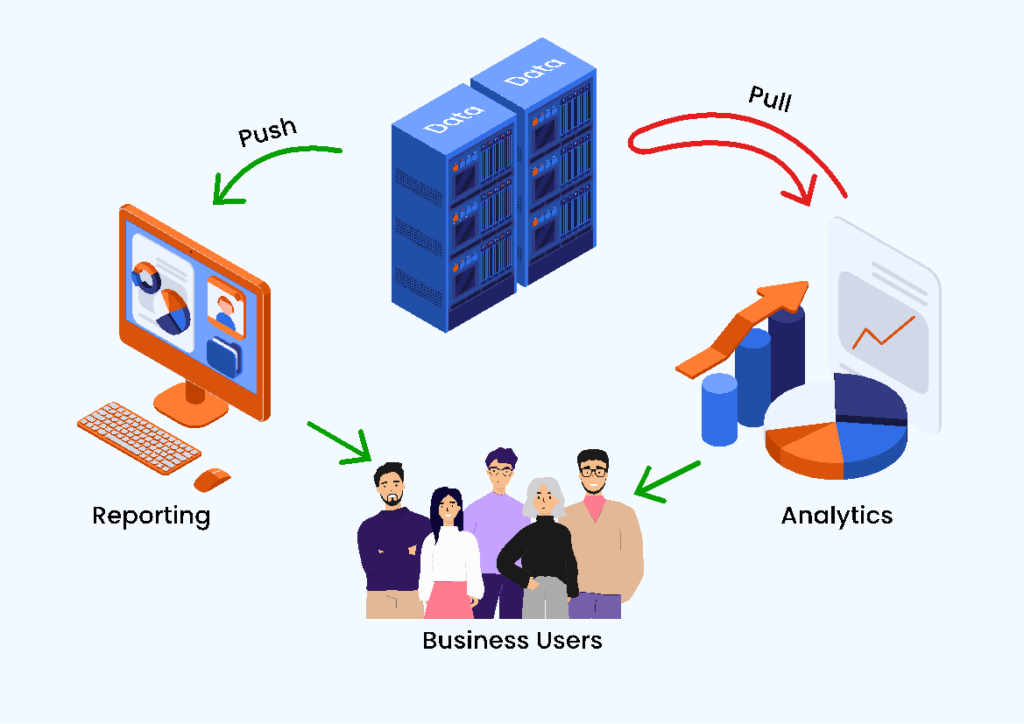
Analytics Vs Reports: What’s the difference?
Analytics is to get the insights from the data provided by the Reports. Analytics help answer the questions that the reports raise questions.
What’s so special about analytics?
Analytics is dynamic and allows contorting data points for a dynamic investigation into the data. Businesses can take actionable recommendations and take insight-driven actions. Analytics tools such as ZOHO Analytics provide inbuilt tracking and data analytics tools, that seamlessly scale with growing data needs in the other sales and marketing apps.
When the organization grows, and there is a growing need for deeper insights to take better informed decisions, often after years of operations. Analytics tools typically help businesses understand business intelligence by managing and analyzing large sets of data.
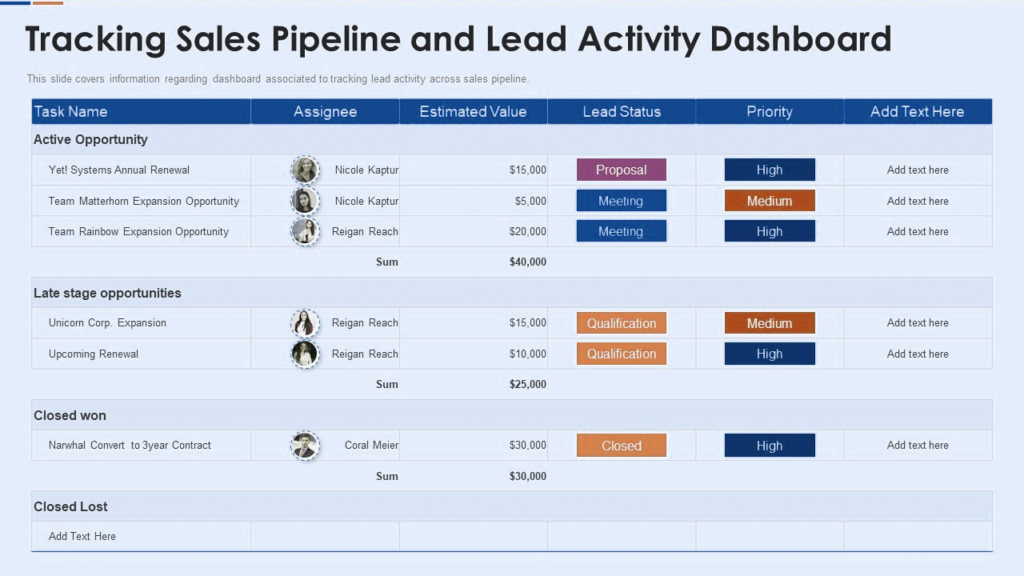
How do you present reports visually?
Here is how a typical Sales report displayed. The organization is well on its way towards the $3M+ Sales mark, but to analyze deeper into how to ensure they hit that mark, analytics is important.
Analytics tool allow user to adjust the filter parameters and drill into different snap shots of the data.
How do you visually present analytics?
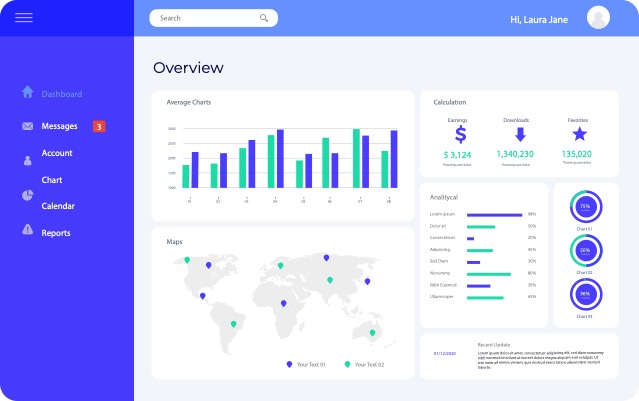
Here is how the sales data is split for routine management but also for quarterly performance evaluations.
Finally, In a data-driven world, having a skilled analytics expert by your side is essential. At Upwise, we are committed to helping SMB make data-driven decisions, achieve business goals, and drive innovation. Don’t miss out on the opportunity to leverage the power of analytics—reach out to us today to schedule a free consultation or sign up for a discovery report and let’s embark on this data-driven journey together.